Data Annotations
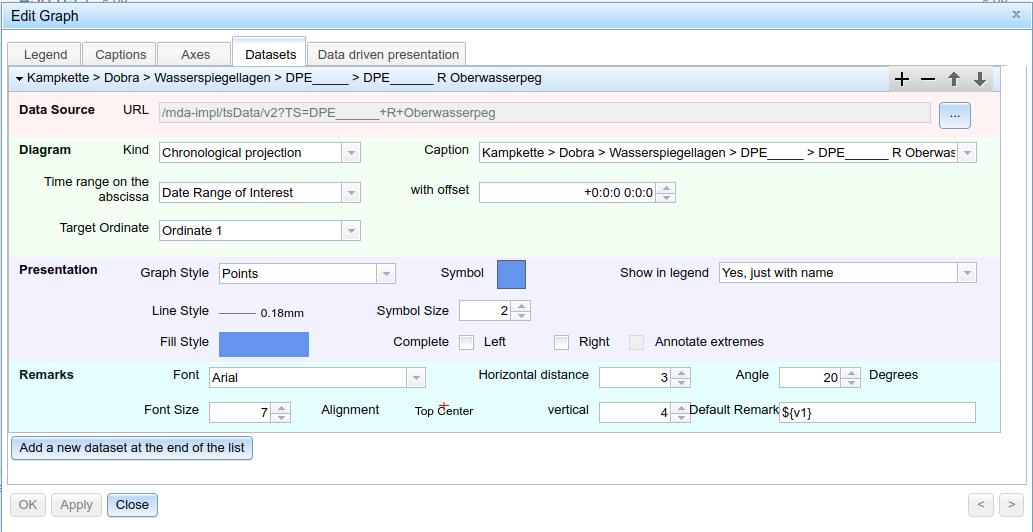
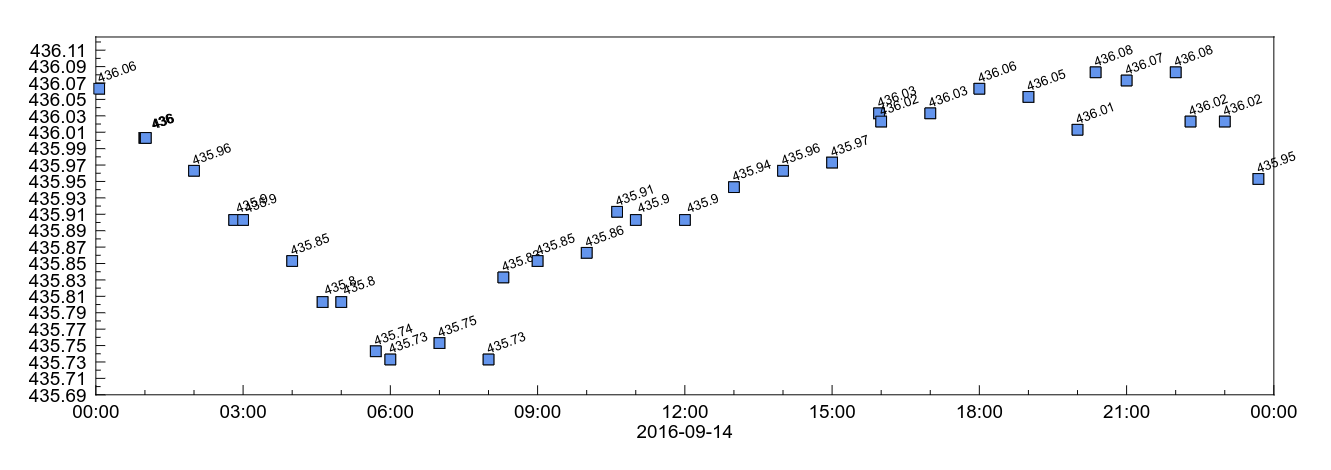
Graphical objects can include annotations for data sets. These can be any kind of text or variables for either timestamps or data points. You can configure these properties in the Remarks section of the Datasets tab.


Time-based Variables for Data Annotation
The following variables are supported:
| Variable | Description | Example |
|---|---|---|
${v0} or ${timestamp} | Timestamp | 08.11.2018 12:17:16 |
${v0 (y)} | only year | 2018 |
${v0 (M)} | year and month | Nov 2018 |
${v0 (d)} | full date | 08.11.2018 |
${v0 (h)} | date and hours | 08.11.2018 12 |
${v0 (m)} | date, hours and minutes | 08.11.2018 12:17 |
${v0 (s)} | full timestamp, same as v0 | 08.11.2018 12:17:18 |
${v0 (MM)} | only month | 11 |
${v0 (dd)} | only day of month | 08 |
${v0 (HH)} | only hours | 12 |
${v0 (mm)} | only minutes | 17 |
${v0 (ss)} | only seconds | 18 |
${v0 (dd)}/${v0 (MM)}/${v0 (y)} ${v0 (HH)}-${v0 (mm)}-${v0 (ss)} | Formatted timestamp | 08/11/2018 12-17-16 |
Data Values in Annotations
When using data values in annotations/remarks, please keep in mind that data variables change depending on the projection type used.
Time-based Projection
For datasets with a time-based data source
| Variables | Description | Example |
|---|---|---|
${v1} or ${value} | Value | 308,258911 |
${v1 (2)} or ${value (2)} | Value rounded to given amount of digits, here 2 | 308,26 |
${v0 (d)} ${value (2)[m.ü.A]} | Formatted timestamp, value and static text | 08-11-2018 308,26 [m.ü.A] |
Parametric Projection
Graphs in which ordinate value 1 is in dependence to value 2, see parametric graph)
| Parameter | Description | Example |
|---|---|---|
${v1} or ${x} | Value 1 | 4,1234114 |
${v2} or ${y} | Value 2 | 10,5678 |
${v1 (0)} or ${x (0)} | Value 1, 0 decimal places | 4 |
${v2 (0)} or ${y (0)} | Value 2, 0 decimal places | 10 |
${v0 (d)} (${x (0)} mm,${y (0)} mm) | Formatted timestamp with value pair | 08-11-2018 (4 mm,10 mm) |
Minimum-Maximum Projection
Annotations are displayed on the upper and lower borders (see minimum-maximum projection)
| Parameter | Description | Example |
|---|---|---|
${v1} or ${min} | Minimum | 5,7854 |
${v2} or ${max} | Maximum | 105,332 |
${v1 (0)} or ${min (0)} | Minimum rounded to 0 decimal places | 6 |
${v2 (1)} or ${max (1)} | Maximum rounded to 1 decimal place | 105,3 |
Interval Projection
See also Interval projection
| Parameter | Description | Example |
|---|---|---|
${v1} or ${min} | Minimum | 5,7854 |
${v2} or ${mid} | Second Parameter (in this case, average) | 50,198 |
${v3} or ${max} | Maximum | 105,332 |
${v1 (0)} or ${min (0)} | Minimum rounded to 0 decimal places | 6 |
${v2 (1)} or ${mid (1)} | Average rounded to 1 decimal places | 50,2 |
${v3 (1)} or ${max (1)} | Maximum rounded to 1 decimal places | 105,3 |
Combining multiple time series
See also the chapter to multi file selection
| Parameter | Description | Example |
|---|---|---|
${v2} | Value | 308,258911 |
${v2 (2)} | Value rounded to 2 decimal places | 308,26 |