Monitoring
See also the concept page.

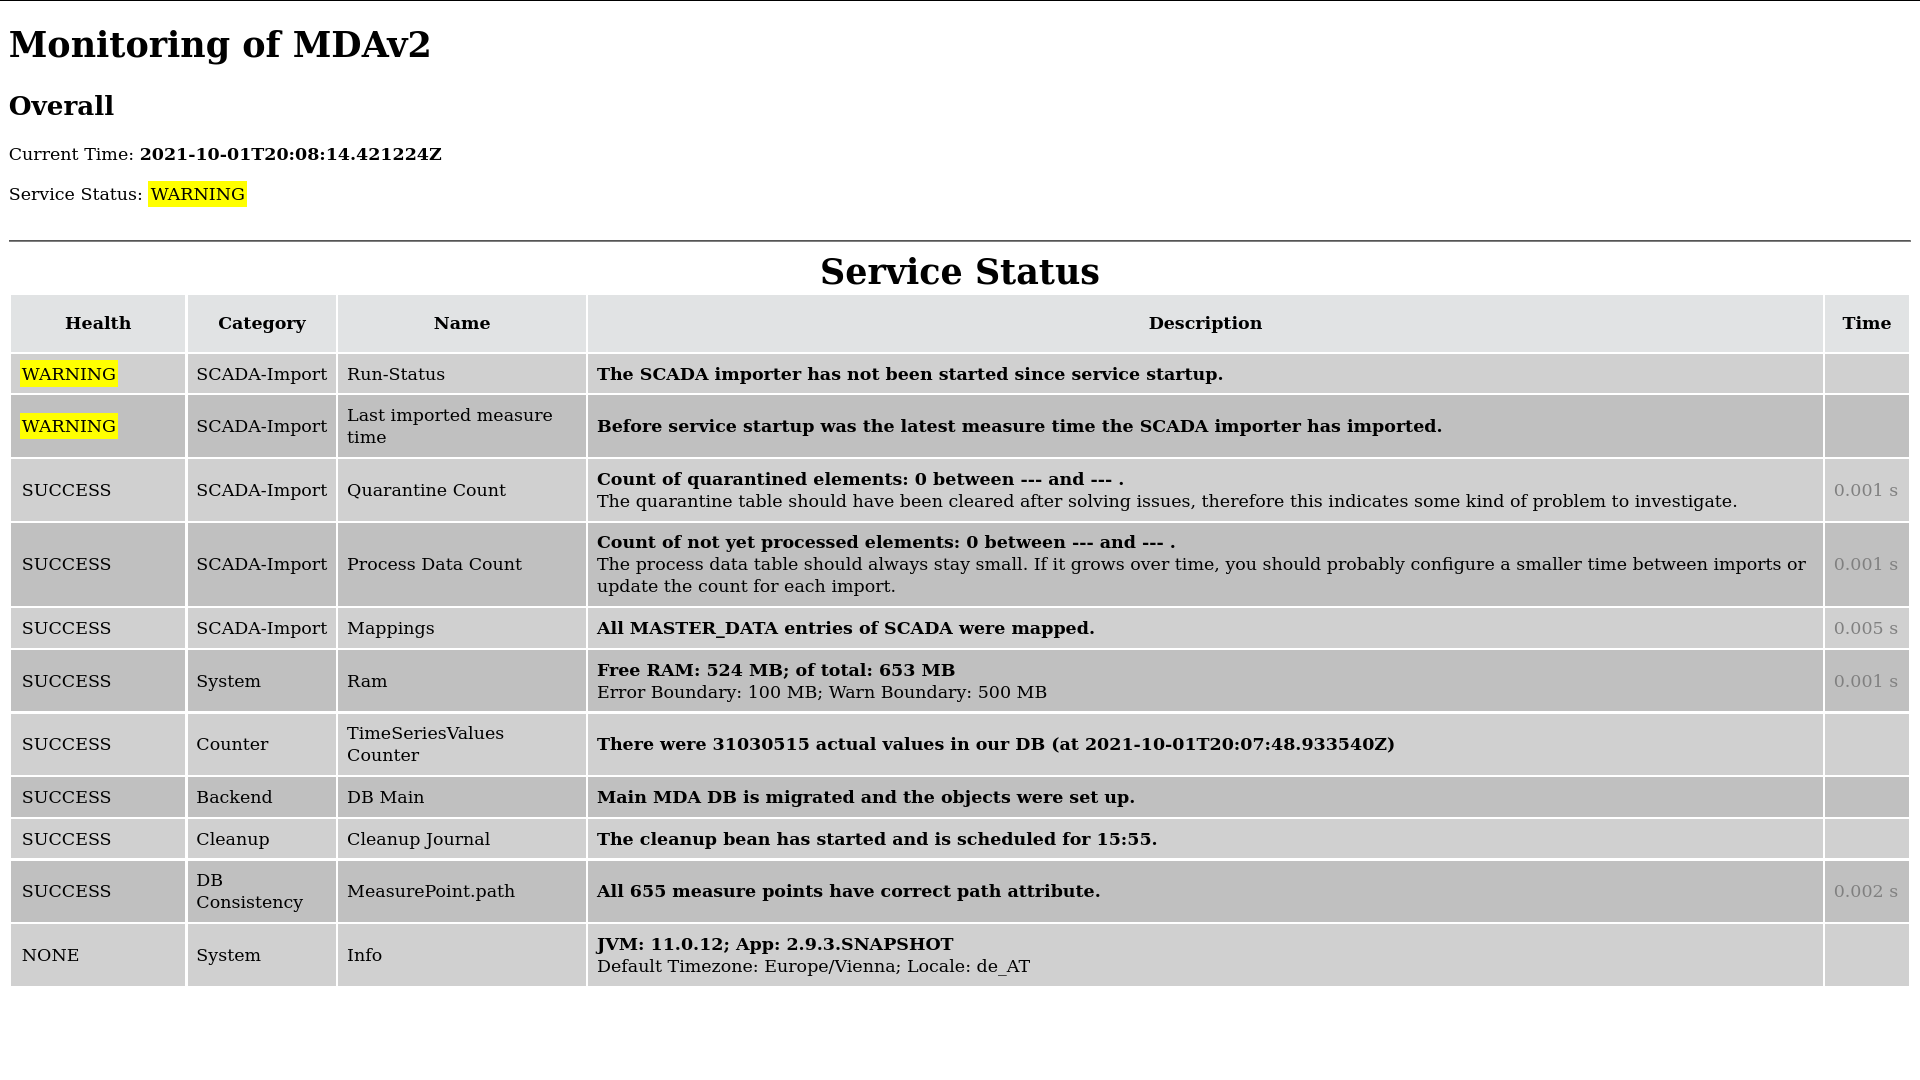
The monitoring page is in English only and will not be translated as its code and data should be as straightforward as possible. It consists of highly dynamic data on the current service status like JVM RAM, importer status, DB status etc
You can get this data as JSON by adding ?json to the URL. See below for details on that.
Health
- SUCCESS: Everything is fine
- NONE: Purely static information, like version numbers(cannot have an ERROR status)
- WARNING: Could be a problem or deactivated.
- ERROR: You should react according to the following list.
Overall
This includes two pieces of information:
- the precise timestamp when the monitoring report was generated.
- The worst of all the available service statuses. If "ERROR", at least one of the services reports an error.
List of monitoring sensors
Cleanup
- Cleanup Journal: Has the cleanup job been started and when was its last run and when is it scheduled to run next.
Counter
- TimeSeriesValues Counter: How many time series values are in the main database.
DB Consistency
- MeasurePoint.path: We are writing the full path of a measure point from the root in an additional field to improve search performance. This monitoring examine its consistency.
- Comment Assignments: Comments without any assignments are not well behaving, as they might be remnants of some deletion or restructuring. Therefore, please assign those comments at least to some measure point or delete them altogether.
- Invalid MeasureRoundValue: If a time series or its measure point was deactivated, no new values should be inserted. However, if outstanding measure rounds are uploaded later, the values are still added. Please review the imported data. This warning stays open until a service restart.
SCADA-Import
- Run-Status: When was the last time the importer job was started and when is the next schedule.
- Last imported measure time
- Quarantine Count: There is data inside the quarantine table in the staging database. After any problem had been resolved and the data was imported successfully, the successful data should be removed from the quarantine table.
- Process Data Count: How many elements are currently in the process data table and what is the lowest and highest measure time stamp. This is highly dynamic, so that an "Warning" or "Error" will almost always be resolved within the next importer cycle. Though, if this item gets yellow more than occasionally, the time between imports should probably be reduced.
- Mappings: Whether all the entries in MASTER_DATA have been mapped to some timeseries inside our MDA database. Currently, it does not examine the opposite.
System
- Ram: The total and free memory of the OSGI runner (including TISGraph) We can configure its warning and error boundary in the OSGI configuration.
- Info: JVM version, installed MDA version, the default timezone and default locale.
- DB Main: Whether the MDA main database is reachable and fully migrated. If not, most other monitoring status will be "error" anyway.
JSON
When requesting monitoring information in JSON form(usually with the relative path /mda-impl/monitoring?json), the JSON response will typically be in the following format:
json
{
  "overall" : {
    "serviceHealth" : "SUCCESS" //Or other health code, see above
    "time": "2021-08-24T11:39:25.992103Z"  //timestamp in the same format
  },
  "services : [
    {
      "health": "SUCCESS",
      "category: "Cleanup", //one of the aforementioned sensor types)
      "name" : "Cleanup Journal", //Name for that service)
      "desc: "desc" *(Some additional information from that service, usually dynamically generated.)*,
      "time": 0 *()*
    },
    .
    .
    .
    (Lists every service individually)
    .
    .
    .
    {
      "health": "NONE",
      "category": "System",
      "name": "Info",
      "desc": "JVM: 11.0.12;  App: 2.10.0.SNAPSHOT\nDefault Timezone: Europe/Vienna;  Locale: en_US",
      "time": 0
    }
  ]
}